


Register here to join our upcoming webinar on the new CIA Mortality Improvements scale (CanMI-2024).
In this instalment of our multi-part series covering the recently releasedReport to the CIA’s Project Oversight Group on Mortality Improvements Research (the “report”) we explore whether population level data is appropriate for projecting mortality improvements for the Defined Benefit (DB) and Insured populations, or whether improvements need to be adjusted before applying to this population.

The key considerations, which we will explore in detail are as follows:
- There can be significant differences in current (baseline) mortality between sub-groups of a population. Longer life expectancies are generally observed in higher socio-economic groups and in the insured population (including the population of Defined Benefit (DB) pensioners) compared to the general population.
- There is a growing body of evidence highlighting that mortality improvements also differ between socio-economic groups and between the insured or DB pensioner populations and the general population.
- The improvement model set forth in the CIA’s report uses historical Canadian population data in two ways:
- Using a regression approach to project near term mortality improvement rates;
- Using time series to calibrate an ultimate sustainable long-term rate of mortality improvement.
- The natural questions to ask then are: Is it appropriate to use general population data to calibrate near-term and/or long-term improvement rates used to project mortality rates for the insured or DB pensioner populations? Or do we need the ability to adjust such calibrations to reflect the characteristics of a given population.
Some historical context
Actuaries have long recognized that longevity varies across segments of a population. One need look no further than the very first mortality study ever performed in Canada, based on data from the late 1800s:
“…the rates of mortality at various insuring ages as shown by the Canada Life experience is more favorable than that looked for by the Government standard…”
Even in 1895, it was acknowledged that the experience of insured groups can differ meaningfully from that of the general population.
Why is it then that mortality improvement tables used by pension practitioners have traditionally been developed on population level data? Mainly this is due to the volume of data needed to achieve statistical credibility – a much larger volume than necessary when constructing base mortality tables. National statistics offices have often been the only data sets of sufficient size. Does this reliance on population introduce biases, and if so, is there a way to quantify and mitigate them?
With information on 1 in 4 Defined Benefit pensioners in Canada, Club Vita’s data, hereafter referred to as VitaBank, is large enough to allow us to identify differences in historical trends between the general population and DB pensioners, allowing us to gauge whether any systematic issues exist with using population level data.
Socio-economic indicators of life expectancy
Club Vita’s research into predictive factors of mortality has shown that socio-economic indicators are a major contributor to differences in current (baseline) mortality. The impact of socio-economic drivers can be seen at both the population level and for defined benefit pensioner populations.
As shown in the chart below, for the period 2016 to 2020, age-standardized mortality rates in Canada for the lowest income quintile exceeded those of the highest income quintile by 35% overall and by close to 50% for males.
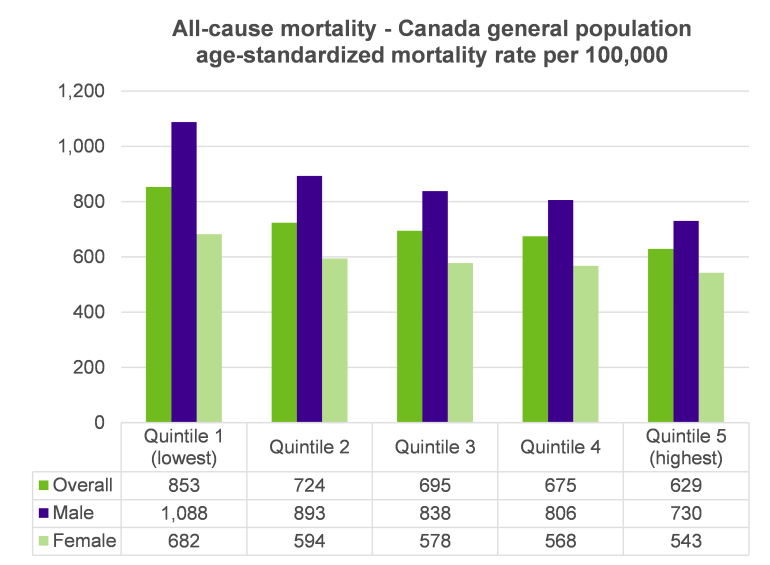
Source: Pan-Canadian Health Inequalities Data Tool. A joint initiative of the Public Health Agency of Canada, the Pan-Canadian Public Health Network, Statistics Canada and the Canadian Institute for Health Information. Available from: https://health-infobase.canada.ca/health-inequalities/Indicat.
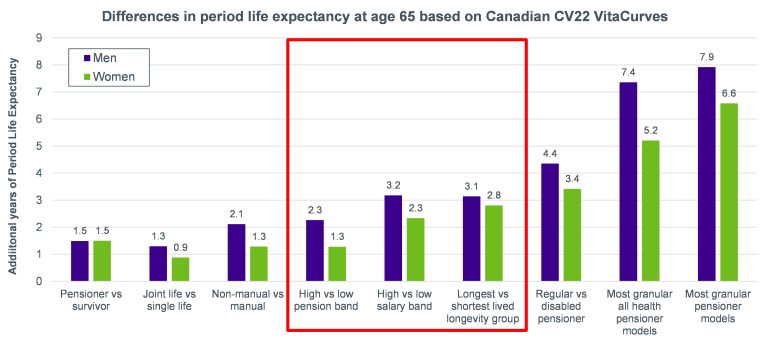
The impact of socio-economic factors on life expectancy is also confirmed by Club Vita’s multi-factor longevity model. The largest predictors of longevity outside of long-term disability are all related to socio-economic status – represented in the chart below by pension amount, salary and longevity group.
Differences between defined benefit pension populations and the general population
Compared to the Canadian population, the individuals contained within VitaBank are more likely to have a:
- More consistent employment history (i.e., lower rates of unemployment) due to defined benefit pension plans being contingent on employment; and
- Higher affluence given the exclusion of those that haven’t been employed or were employed informally.
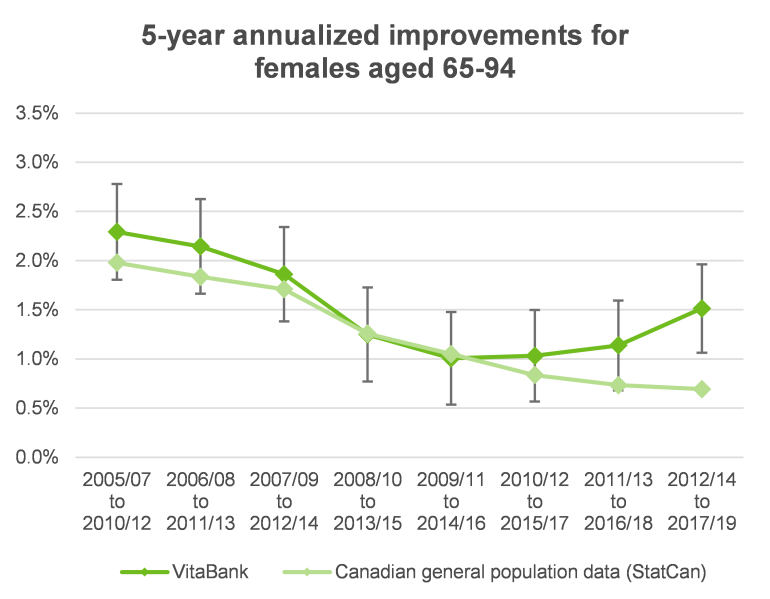
These characteristics suggest defined benefit pension plan members would be expected to live longer than the Canadian population. The chart below bears this out and shows that period life expectancy for the VitaBank data has consistently exceeded that of the general population:
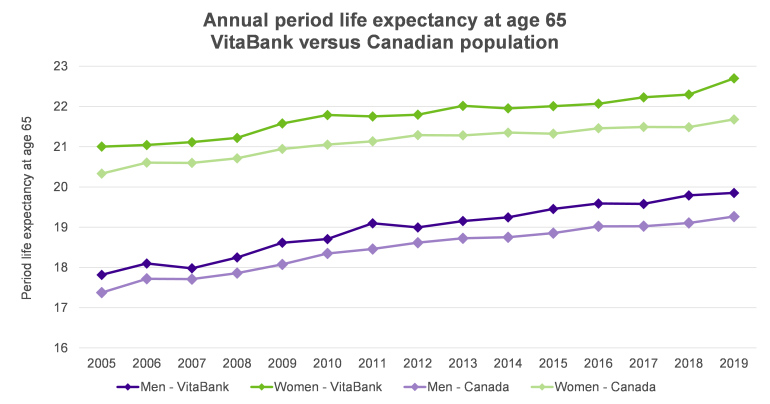
Notes: The life expectancies shown above only account for mortality from age 65 to 94. VitaBank data based on pensioners and survivors with complete and reliable from 2005 to 2019. Canadian results are based on Statistics Canada annual death data and July 1st population estimates.
If one looks closely, it can also be observed that the difference in life expectancy has grown slightly over time, suggesting that the longevity of DB pensioners has increased faster than the general population from 2005 to 2019.
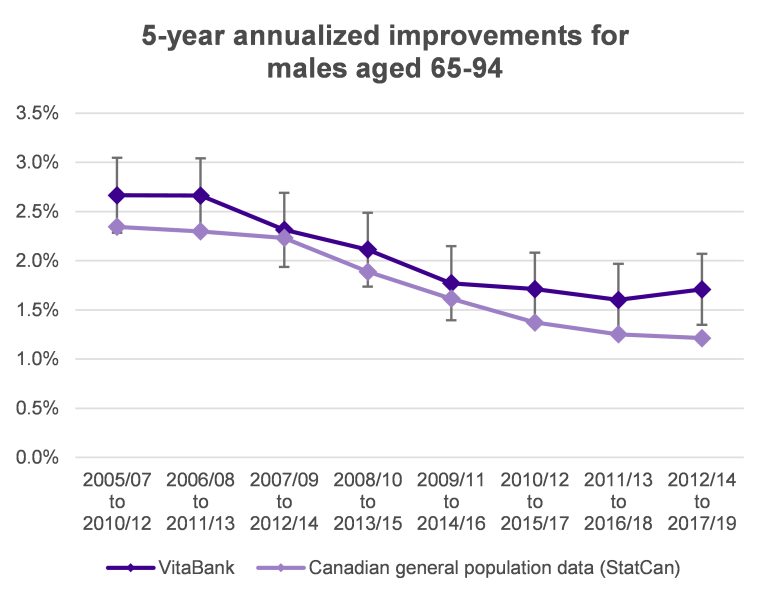
Club Vita’s database of Canadian DB members is sufficiently large to allow for a credible analysis of the impact of socio-economic factors on mortality improvements over the period of 2005 through 20191.
Our analysis confirms that mortality improvements observed within the VitaBank data have exceeded those of the general population. Note however that the differences have generally fallen within a 90% confidence interval and thus should be viewed as being indicative as opposed to statistically significant.
By delving deeper into the data, we can see that there has been a correlation between socio-economic status and mortality improvements.
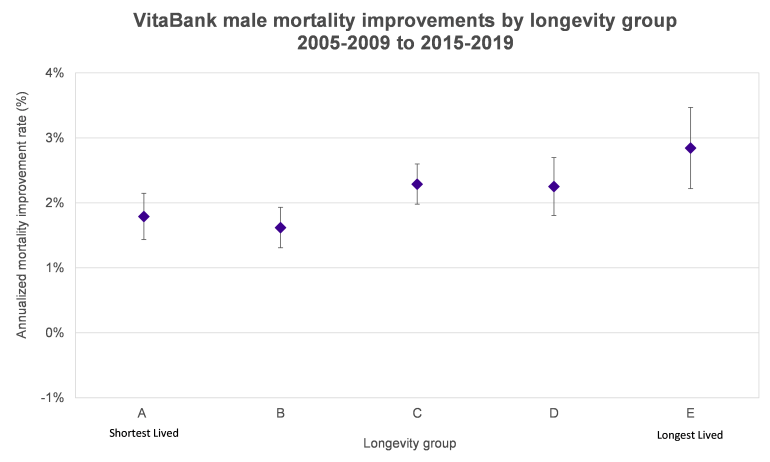
The chart below shows the annualized longevity improvements for VitaBank male pensioners and survivors across ages 65 to 94 based on mortality experience for years 2015-2019 versus that for 2005-2009, separately by longevity group from the shortest lived (lower socio-economic status) group A to the longest lived (higher socio-economic status) group E. We can see that the annualized improvements have been relatively lower for lifestyle groups A and B (1.8% and 1.6% respectively), higher for C and D (both 2.3%) and higher still for lifestyle group E (2.8%). These results suggest the difference in baseline longevity between male lifestyle groups has been widening over 2005 to 2019.
Is population data appropriate for projecting mortality rates for DB pensioners?
It’s clear that baseline mortality is impacted by socio-economic status and there are strong indications that these differences have been widening. This suggests that over the past 20 years at least, socio-economic status has played a sizable role in mortality improvements.
It would be going too far to say that using population data is inappropriate for developing mortality improvement scales for pension plans. However, caution and judgment is required. Two areas for consideration spring to mind:
- In the near-term, consideration could be given to the socio-economic profile of pensioner population in question; and
- In the longer term, we should consider the underlying causes of the divergence in mortality experience between higher and lower socio-economic classes and give thought as to whether these influences are likely to change.
In the near-term, it is often reasonable to assume that recent trends continue. For plans with memberships that skew to the upper (lower) end of the socio-economic spectrum it would be reasonable to expect mortality improvements that exceed (are less than) those experienced by the general population.
Over longer time periods, more thought is required - it isn’t a given that the current trends will continue. The chart below shows one such example. In the middle part of the 20th century, improvements in female mortality far exceeded those of males (shown by the divergence of the green line from the purple), a trend that has reversed in recent times (shown by the convergence of the two lines over the past 20 years).
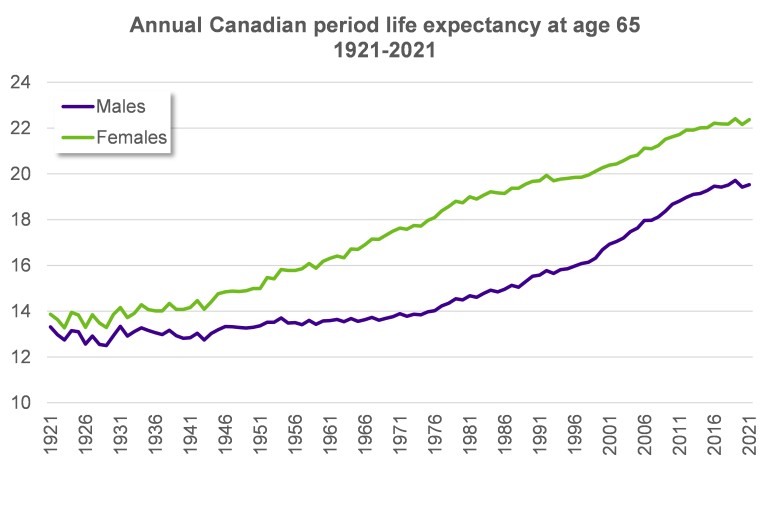
Source: Human Mortality Database
To assess the likelihood that lower socio-economic groups may close the gap in life expectancy, considering the factors that led to the recent divergence is a good place to start.
Let’s consider the example of smoking cessation, a large driver of mortality improvements over the past 40 years. The proportion of adult Canadian males who smoke has declined from around 60% in 1965 to 12% in 20202. While the impact of smoking cessation will continue to flow through mortality for decades to come, rates of smoking dropped more quickly among those in higher socio-economic classes. Further, according to a study by the Canadian Institute for Health Information, in 2003, the rate of smoking among the adults in the lowest quintile of income was 1.5x that of those in the highest quintile, a figure that grew to over 1.9x by 20133. Unless low-income Canadians reverse this trend, improvement rates for low-income Canadians are more likely to persist in the long-term. However, if the gap in usage were to shrink, it is possible that the lower improvement rates for low-income Canadians will reverse.
This same study contained other interesting insights into why socio-economics has played a role in longevity. The study showed that people in the top income decile were:
- More likely to get vaccinated against the seasonal flu (seniors only);
- Less likely to be obese, (only for females, male obesity rates were similar);
- Much more likely to attend university (see Shantel Aris' recent article to read more on the link between education and longevity); and
- Less likely to be hospitalized for alcohol related incidents.
There are many unknowns when it comes to the change in future mortality improvements. In reality, this leads to a range of likely future outcomes. Perhaps this is why the Mortality Projection Committee (MPC) of the Institute and Faculty of Actuaries in the United Kingdom has chosen not to specify a long-term improvement rate as part of their Continuous Mortality Investigation (CMI) project. The long-term rate is determined by actuarial judgement.
It’s not just the long-term rates that actuaries have discretion over. The MPC provides software to allow actuaries to alter the level of short-term improvements and how the short-term rates converge with the long-term. With the uncertainty around future trends and limitations of population data, this is an approach we believe the CIA should seriously consider.
Conclusion
So, is population level data appropriate for projecting mortality improvements for the Defined Benefit (DB) and Insured populations? It is not necessarily inappropriate, but we think there are some important caveats and considerations:
- The data volumes required for statistical credibility mean that population level data is useful in developing improvement scales, at least as a sense check against other smaller data sets.
- Both population level data and pension plan data show evidence that not only is life expectancy positively correlated with socio-economic status, but also that the range of outcomes is diverging. Improvement rates have differed meaningly between different socio-economic groups. Improvement rates, especially in the short term, are likely to vary based on the demographics of a plan’s population. Some discretion is likely warranted estimating future improvement rates.
- In the long-term it is not a given that the divergence in life expectancy between socio-economic groups will continue. Given all the variables that contribute to changes in life expectancy, there are a range of likely outcomes. This suggests that there isn’t one right answer and some discretion on the part of the actuary would be desirable.
Discretion is allowed for in other countries, including in the use of the CMI model in the UK. We would like to see the CIA explore options to allow some discretion in tailoring assumptions for specific populations.
1The beginning of this period is the earliest data at which Club Vita has sufficient continuous mortality experience to conduct the analysis. The end of the period aligns with that of the report and avoids capturing impacts related to the COVID-19 pandemic.
2 https://uwaterloo.ca/tobacco-u...(Figure%201.1).