Last year, when I told my British friends and colleagues I was moving to Canada, the most common reaction (aside from “good riddance”) was “it’s cold there, isn’t it?”. They might have been shocked to learn of the very unfortunate reports1 that there were up to 70 deaths caused by the July heatwave in Quebec this year.
I came across an interesting piece of research2 in the medical journal The Lancet on the effect of temperature on death rates, showing wide variation across Canada. This also struck a chord as Club Vita Canada has found that geographic information about a pension plan’s membership is a key factor in explaining a plan’s mortality experience (i.e., the rates at which pensioner deaths occur). However, Club Vita Canada’s findings indicate that geographic information is particularly helpful because it captures the combination of both geography and the socio-economic characteristics of people living in different geographic areas (via postal codes).
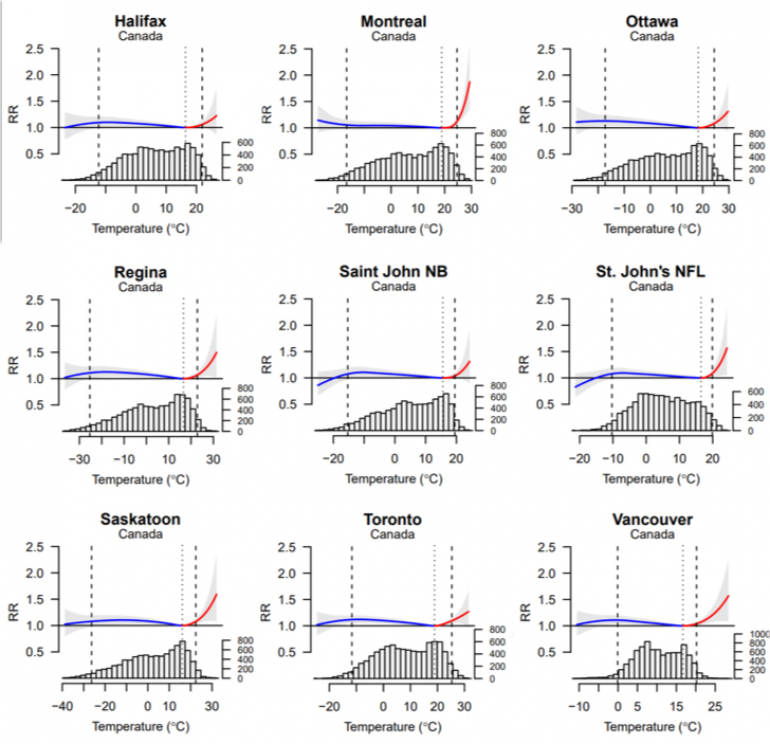
The red and blue lines in the charts below show the relative risk (RR) of death at different ambient temperatures for major cities across Canada. The bars below the lines show how many days between 1986 and 2009 reached each temperature. The vertical dashed lines at each side show what temperatures might be considered extreme based on only 2.5% of days being hotter than the line on the right, and 2.5% of days being colder than the line on the left.

1Source: CBC News: Quebec says up to 70 people may have died in connection with heat wave
In Montreal, for example, death rates are lowest when the temperature is close to 19°C (indicated by the vertical dotted line). What stands out is that extremely low temperatures barely move the needle in Montreal, whereas the risk of death nearly doubles when temperatures reach 30°C. These results highlight that the risk associated with extreme heat is not a recent development in Montreal.
Montreal appears to be an extreme example. In Toronto, the increased risk of death due to extreme heat has historically been much less, despite a similar temperature range in the two cities. The authors of the study pointed out in an earlier report3 that houses in Quebec are typically well-heated in winter, but relatively few (25.6% in 2008) have air conditioning.
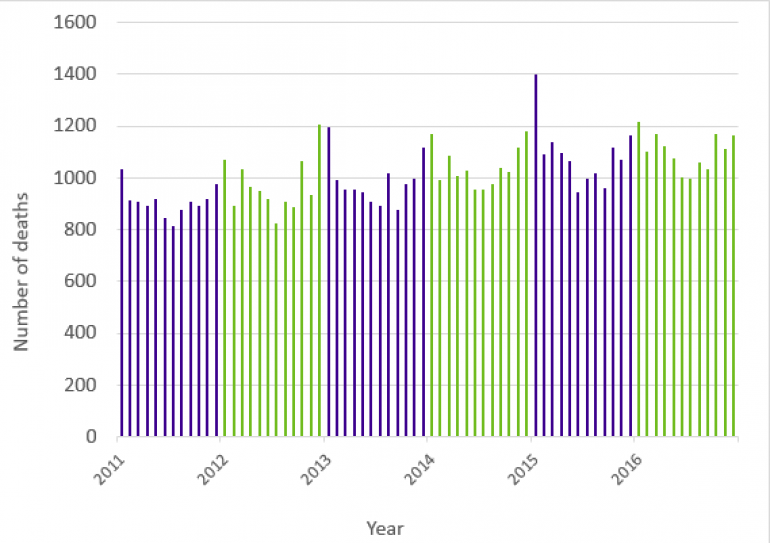
It’s important to remember that, although the relative risk of death is higher when temperatures spike upwards, the overall death rate is higher in winter than in summer. The chart below shows the number of deaths by month from 2011 to 2016, based on pension plan data collected by Club Vita Canada. The numbers are consistently higher in the winter months, seen as the spikes at the beginning and end of each calendar year.
Number of Deaths per Months4

4Source: Club Vita Canada
Looking forward, the Canadian Centre for Climate Modelling and Analysis has projected a rise in average temperatures across Canada of about 2°C by 2050. On the face of it, that might lead to longer life expectancies by reducing the effects of long, hard winters. However, one of the forecast side effects of climate change is an increase in extreme weather events – like the recent heatwave in Quebec.
Temperature is just one factor influencing Canadian mortality. The complexity of its influence and uncertainty about how its influence may change in the future highlights why trends in mortality rates are so difficult to predict. Through Club Vita Canada, we are continually investigating mortality trends and contributing factors to help pension plans better assess the impact of mortality and plan for the future.


