


Register here to join our upcoming webinar on the new CIA Mortality Improvements scale (CanMI-2024).
An important part of projecting possible future changes to mortality rates is understanding some of the key drivers of change and how these might evolve over time. What could cause future improvements (or deteriorations) to mortality rates? How do we build these into our projection models? Is the past a good measure for the future? Will any changes to mortality differ by factors such as gender, socio-economics or age? The model set forth in the Report to the CIA’s Project Oversight Group on Mortality Improvements Research (the “report”) uses historical data (from 1980-2019) for the Canadian population in two different ways:
- Using a regression approach to project near term mortality improvement rates;
- Using time series to calibrate an ultimate sustainable long-term rate of mortality improvement.
In both applications, it makes the implicit assumption that the mortality improvement dynamics in the 1980-2019 calibration data are representative of how mortality will change in the future. The report does not focus on the justification for this assumption, but it is important to consider. Further, justification for using this calibration period may be different for near term improvement rates than for long term sustainable improvement rates. The natural questions to ask, are:
- What caused the mortality improvements that we saw from 1980-2019?
- Will these causes continue to drive mortality improvements in the near term? And in the long term?
- Are there other factors that could drive improvements or deteriorations in mortality rates in the near term? And in the long term?
- Are the historical dynamics observed for the general population appropriate to use for different populations (such as different socio-economic groups or the insured vs uninsured populations)?
We have focused our commentary on older age mortality as this is the area that will impact annuity providers and defined benefit pension plans the most.


Looking back: Drivers behind the significant improvement in life expectancy over the past century
The Canadian Office of the Chief Actuary produced a comprehensive study of drivers of mortality improvements in Canada over the last 100 years in their 2021 paper Mortality Projections for Social Security Programs in Canada, which we heartily recommend. Below we summarize some key themes that have implications for using historical data to project near term and long-term improvement rates.
The chart below illustrates the annual Canadian period life expectancy at age 65 between 1921 and 2021 for both men (purple) and women (green). Although both men and women saw a rise in life expectancy over the span of 100 years, it's important to highlight that the rate, and sometimes timing, of this increase differed between men and women.
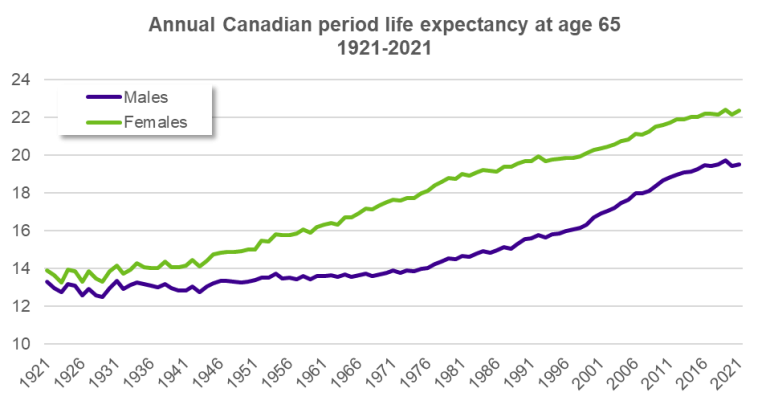
Source: Human Mortality Database
We observe significant improvements in later age longevity for both men and women over the last 100 years. Improvements for women have progressed fairly uniformly since the 1960s. In contrast for men, improvements were fairly flat through the 1960s and then progressed much more quickly from the 1980s to the 2000s. To show the difference this time period makes: both men and women saw improvements of around 6 years in life expectancy at 65 over the period 1960-2019. However, over the period 1980-2019, male life expectancy at 65 increased by over 5 years, and female life expectancy at 65 by less than 4 years.
To illustrate some of the drivers of these improvements, in the following charts we have plotted age standardized deaths per 100,000 lives for men (left chart) and women (right chart) aged 65 years and over between 1950 and 2022. The charts depict deaths attributable to various causes of death, highlighting their respective contributions to overall mortality trends over time. Cause of death charts, such as these, do not tell the whole story on mortality improvements, as we are really trying to understand the root cause behind the rate of change of a particular cause of death (as used in cause-of-cause-of-death models).
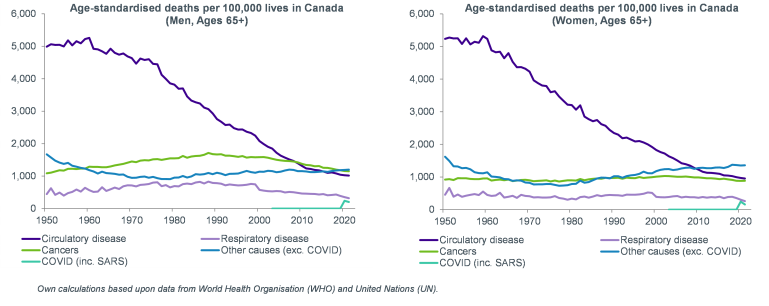
There was a period of significant improvement in life expectancy between the 1960s and late 2000s largely attributable to reductions in deaths linked to circulatory disease. The reduction in deaths due to circulatory disease during this period were underpinned by multiple factors: improved lifestyles (e.g. smoking cessation); new drugs (e.g. statins); and new treatments medical technology (e.g. stents).
Much as improvements over the period 1960-2000 are largely driven by decreases in the number of circulatory disease deaths, so are the differences in improvements between men and women. In fact, the slower rate of improvements during the 1960s and 1970s for men correspond to higher smoking rates, and the more rapid improvements in the 1980s-2000s in men correspond to greater reductions in smoking rates.
After 2010, we observe slower rates of improvement than that seen between the late 1990s and 2010, largely due to a reduction in improvements related to circulatory disease. Another notable trend is the increase in deaths associated with other causes, driven by an increase in Alzheimer’s and dementia. Similar trends are observed in the UK and in the US.
Looking ahead: You can’t cure the same disease twice!
If we are going to use historical data to project improvements into the future, we need either to convince ourselves that the drivers of historical changes in mortality rates will continue to drive change in the future, or that they will be replaced by other drivers with similar impact. The rapid reductions in mortality rates due to circulatory diseases over the last 60 years have been remarkable, but they cannot continue indefinitely. So, what headwinds and tailwinds could we consider?
- COVID-19: the implications of long COVID remain uncertain. The effects of the virus on vital organs such as the heart, lungs and, in some cases, even the brain, suggest there may be an increase in comorbidities in the future.
- Strain on healthcare system: Canada's healthcare system was strained even prior to the pandemic and is now facing even greater pressure, with wait times reaching unprecedented levels. Canada’s aging population is likely to exacerbate strain on an already burdened system. As discussed in our recent Top Chart, increased wait times are associated with increased mortality.
- Medical advancements: Advancements in mRNA vaccine technology, spurred in part by the COVID-19 pandemic, hold promise for future cancer treatments. Early research also suggests potential unintended benefits of using drugs such as “Oh oh oh” Ozempic as a weight loss drug, which could potentially lead to a significant reduction in obesity rates. This, in turn, might reduce disease associated with obesity and alleviate some pressure on the Canadian healthcare system.
- New diseases: Alzheimer's and dementia typically manifest in older individuals and are therefore less prominent in areas with lower life expectancy. As human life expectancy increases, the possibility of new neurological diseases emerging also increases.
- Immigration: Shifting demographics can also have an impact on life expectancy. Canada’s 2023 population growth rate, primarily driven by immigration, was the highest since the late 1950s. OSFI’s report on Mortality Projections for Social Security Programs in Canada suggests this may increase life expectancy due to the healthy immigrant effect - an observed lower level of mortality in immigrants possibly due to health screenings included in the immigration process.
- Climate change: Climate change could have a negative long-term impact on the health of Canadians by exacerbating the spread of infectious diseases (e.g. lyme disease). Additionally, climate-related natural disasters (e.g. forest fires) and extreme weather events (e.g. British Columbia heat wave in 2021) also contribute to potentially higher mortality and disability rates.
The “Outlook” section of the CIA report recognizes the importance of understanding cause-of-death trends as drivers for mortality improvements, but the challenge in moving from all-cause mortality models to cause-of-death models (or even cause-of-cause-of-death models) is that they rely much more on expert judgment. Our Longevity 102:improvements/trends webinar explores these models in greater detail, and our webinar Looking to the horizon: how should we set long term longevity improvement rates? takes a deeper dive into considerations for setting long term improvement rates.
When making projections, it’s important to consider factors such as limits in reducing mortality rates, impact on longevity (positive or negative), and whether changes are to be expected in the short and/or long term. Furthermore, it's important to recognize that certain trends may have varying implications on certain demographics. Understanding the different gender-specific effects, age-related effects and impacts on different socioeconomic groups will enable more comprehensive insights into future trends and potential life expectancy outcomes.
If you are interested in learning more, we have also recently been hosting a webinar series focusing on potential factors driving significant future longevity improvements. See here for recordings of the series so far, and details of future sessions.
Conclusion
- Using historical data to project future mortality improvements makes the implicit assumption that the rate of change in mortality rates witnessed in the past is representative of how things will change in the future.
- For near term rates, it is easier to justify a continuation of recent trends[1]; causes of recent trends may well continue to have an effect for a number of years. However, we should still be careful to understand how different populations may have experienced recent trends in different ways and monitor any emerging drivers of change that may not have featured in recent data.
- Long term rates are much more subjective. It is not clear that historical improvement rates are necessarily representative of the long-term future. Historical drivers of change cannot always continue indefinitely. If someone doesn’t smoke, they can’t give up smoking! Whereas long term historical improvements may give us a useful benchmark, it may be more appropriate to base long-term projected improvement rates on an expert driven factor-based analysis or scenario analysis, rather than assuming a direct replication of what happened in the past.
- Lastly, as highlighted in the report, it is important to understand gender-specific effects, age-related effects and socioeconomic effects of mortality improvements. This will help inform considerations for the future and tailor assumptions for the population in question. We will look at this in more detail in the next article in this series.
[1] Providing we assume events such as the recent/ongoing COVID-19 pandemic are transient in nature, and we exclude them from both our calibration data and the future period we are trying to model.