


There’s an old actuarial joke in which someone finds himself treading water in the middle of a 10-foot-deep lake, after being told by an actuary that the lake was five feet deep on average. Averages can help you test the waters. But a proper understanding of your environment often requires a deeper dive.

Life expectancy offers a quick glimpse into how long we’ll each live, on average. Go deeper, however, and you’ll find that health, lifestyle, affluence, geography and other factors affect the life expectancy of individuals.
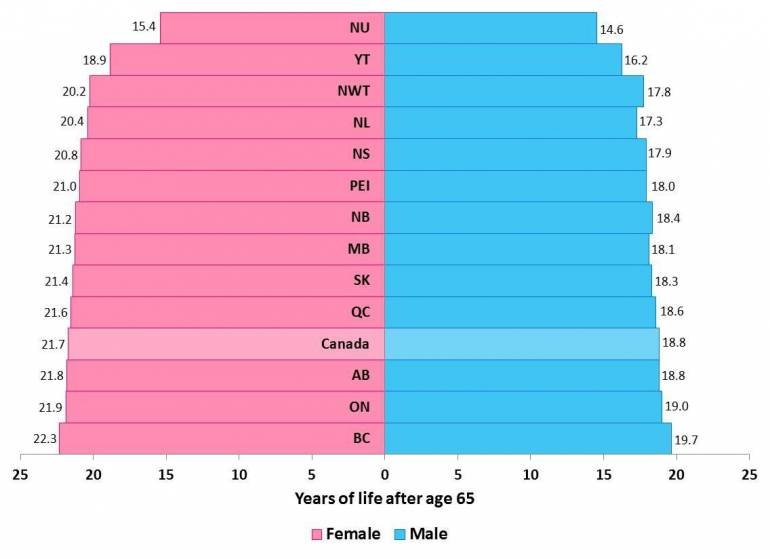
The following uses data published by Statistics Canada to look at life expectancy at age 65 for males and females at both the provincial level and for local areas called health regions.
Examining provincial averages
Figure 1 shows life expectancy at age 65 by province and gender, sorted by female results in ascending order. Life expectancy in Canada’s northern territories is the lowest in the country for both genders. Three of the four Atlantic Canada provinces are next, with New Brunswick, Manitoba and Saskatchewan in the middle of the pack. Quebec and Alberta are closer to the Canadian average. Ontario and British Columbia are the only two provinces with both male and female life expectancies above the Canadian average. Based on this, there is approximately a 2- to 2.5-year difference in life expectancy based on province (excluding the territories).
Figure 1: Life expectancy at age 65 by province and gender (SOURCE: Statistics Canada, Life Tables, Canada, Provinces and Territories, 2009-2011)
The deeper dive
In Figure 2, we take a closer look at southern Ontario and southern British Columbia. Health regions in these areas have been divided into bands based on male life expectancies at age 65, ranging from 16.6 years to 22.4 years. The orange, dark purple and blue portions of the map represent the health regions with the highest life expectancy, and the green and yellow portions indicate the lowest.
The results show life expectancy variations of about three years in southern Ontario based on health region. Health regions in the Greater Toronto Area have the highest life expectancy in southern Ontario, while the Hastings and Prince Edward Counties health region has the lowest.
The southern half of British Columbia is sparsely populated and also has less variation in male life expectancy compared to southern Ontario. Interestingly, the city of Richmond which is part of the Metro Vancouver area, stands out has having the province’s highest average life expectancy. In fact, Richmond has the highest life expectancy in Canada for both males and females.
Figure 2: Male life expectancy at age 65 by Health Region (SOURCE: Statistics Canada, Health Profile, December 2013)
By closely analyzing just one of the factors that affect life expectancy, we see that life expectancy isn’t as straightforward as it appears on the surface. Canada is a large and diverse nation, so it’s important for pension plans to look beyond averages to better understand and manage the longevity of their plan membership.