Question:
How do varying mortality assumptions influence normal cost contributions in a US defined benefit pension plan?
Answer:
Actuarially determined contributions (ADC) represent the employer’s annual payment required to ensure that a defined benefit pension plan is adequately funded. These contributions are critical to maintaining the plan’s solvency, as they ensure that sufficient assets are set aside to meet future pension obligations. The ADC is calculated based on several actuarial assumptions, including investment returns, salary growth, retirement ages and mortality assumptions (the expected lifespan of participants).
When participants are expected to live longer, the pension plan must account for a longer payout period, which increases the total cost to the plan. Consequently, employers must contribute more to keep the plan sufficiently funded. Conversely, if mortality assumptions indicate shorter lifespans, the overall liabilities of the plan decrease, resulting in lower required contributions.

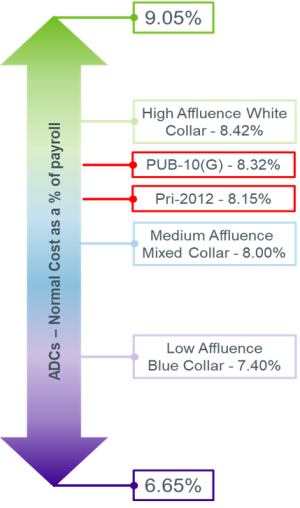
Actuarially Determined Contributions (ADCs) – Normal Cost as a percent of payroll using different mortality assumptions
To demonstrate how mortality assumptions affect contribution rates, we created a hypothetical pension plan and analyzed the impact of various mortality tables on the normal cost contribution rate. The plan uses entry age normal actuarial cost method and incorporates industry-standard assumptions for US public plans (listed below).
All assumptions remained constant except for the mortality assumptions. We applied the US VitaCurves CV22v2 tables to simulate 3 different participant groups: high affluence white-collar, medium affluence mixed-collar, and low affluence blue-collar. Additionally, we included simulations using our longest living and shortest living VitaCurves tables. We compared these to the SOA’s most recent mortality tables (Pub-2010 General & Pri-2012 tables).
The results revealed a 1.02% difference between the contribution rates for the high affluence white-collar and low affluence blue-collar groups. The overall range between the highest and lowest contribution rates across all mortality tables was 2.40%.
Using a standard table to determine ADC without accounting for demographics of participants may lead to mis-estimation of required contributions. It could also lead to cross-subsidization of funding, where an employer might be overcontributing for some participants and under contributing for others. The plan is paying much higher contributions rates for their low affluent participants than needed and lower contributions for their high affluent participants than needed.
Using assumptions that better fit the plan participants can ensure that contributions are not only adequate but also equitable across different participant groups.
Source: Club Vita calculations for a hypothetical pension plan using the following assumptions;
Assumptions: Discount rate = 6.5%; Gender = Male; Valuation date = 1/1/2024; Improvement scale = MP-2021; Entry Age into the plan = 30; Retirement Age = 62; COLA = 2.0%
Key takeaways:
- Changes in mortality assumptions directly influence the ADC. Longer life expectancies increase liabilities and require higher contributions, while shorter life expectancies reduce the required funding
- Using mortality tables specific to participant demographics results in more precise contribution rates.
- Using industry standard mortality tables for ADC may lead to cross-subsidization causing overfunding for some participant groups and underfunding for others, leading to inequities in contributions.
The key questions are:
- How significant do you think the difference in mortality assumptions are in impacting pension plan funding?
- Could a more customized approach to mortality assumptions lead to better long-term sustainability for pension funds?


