In this regular column, Club Vita’s longevity experts will help you visualize the often abstract world of longevity risk by introducing some of their favorite charts.
Question:
Has inequality in life expectancy between socio-economic groups in the US increased over time?
Answer:
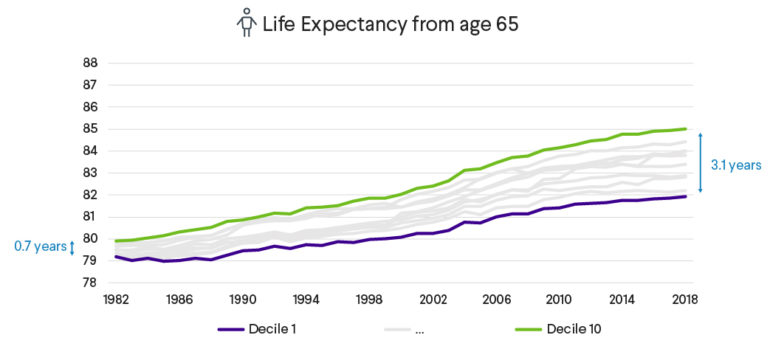
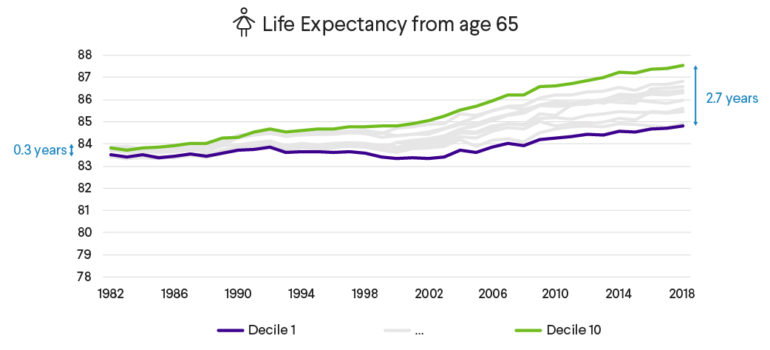
Yes. Not only does life expectancy differ between socio-economic groups in the US, but this difference has been growing over time. Recent research published by the Society of Actuaries (SoA) shows that the difference in life expectancy at 65 between the US counties with the highest and lowest Socio-economic Index Scores1 (SIS) is now over four-times greater for men and nine-times greater for women than 35 years ago.
The charts below show the progression of life expectancy at age 65 for the different socio-economic deciles from 1982 to 2018.


Source: Club Vita presentation of December 2020 version of Society of Actuaries (SoA) life tables by SIS decile as published on SoA website: https://www.soa.org/resources/research-reports/2020/us-mort-rate-socioeconomic/
Key takeaways
- Over this period, improvements in life expectancy at 65 have been far greater for higher socio-economic groups and we see widening inequality over time.
- Given the differences in improvement rates, improvement scales calibrated to the average experience of the general US population may not be appropriate for projecting mortality rates for defined benefit pension plans.
- Given the widening inequality, there is an increased need to capture diversity in life expectancy between individuals (and between different pension plans) when measuring baseline mortality.
The key questions are:
- Will this inequality increase, and improvements continue at different rates for high and low socio-economic groups?
- Have participants of defined benefit pension plans experienced significantly different improvement rates compared to the US population?
- How can you work out where a specific pension plan’s participants sit in the range of different improvements?
What do you think?
1 The Socio-economic Index developed by the SoA is based on factors such as educational attainment, income, unemployment rates, housing levels and employment type. Each US county is scored based on responses to the American Community Survey (ACS), ranked and grouped into deciles. Mortality rates for each decile are computed and compared, enabling an assessment of trends over time for different socio-economic groups in the US.


